
Fit and interpolate data; read files
Read a file
Section titled “Read a file”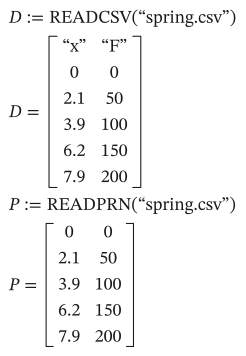
As text
D := READCSV("spring.csv")
D = ?
P := READPRN("spring.csv")
P = ?| Function | Reads |
|---|---|
READPRN("file") | A text file of numbers in columns (spaces, tabs, commas or semicolons); lines that aren’t numbers, such as a header, are skipped |
READCSV("file") | A CSV file: numbers as numbers, the rest as text |
READFILE("file", "csv"), READFILE("file", "delimited") | The same, or with spaces, tabs or commas between cells |
READEXCEL("file", "Sheet1!B2:B10") | An Excel workbook’s values (.xlsx or .xls): the first sheet’s cells, or a range |
- The file name is relative to the sheet’s folder, so save the sheet first.
- The file is read again whenever the sheet is worked out, so the sheet follows its data.
- Values come without units. Multiply a column by its unit:
x := P^<0>*1 mm.
Reading files is in the desktop app; the browser can’t reach your files.
Fit a straight line
Section titled “Fit a straight line”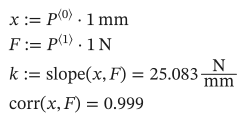
As text
x := P^<0>*1 mm
F := P^<1>*1 N
k := slope(x, F) = ? N/mm
corr(x, F) = ?
intercept(x, F) gives the other end of the line.
Interpolate
Section titled “Interpolate”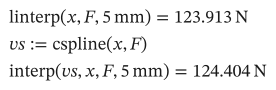
As text
linterp(x, F, 5 mm) = ? N
vs := cspline(x, F)
interp(vs, x, F, 5 mm) = ? N
linterpdraws straight lines between the points.cspline,psplineandlsplinemake a smooth curve through the points (with cubic, parabolic or straight ends);interpreads it at a point.- The x values must be in ascending order.
Fit a curve
Section titled “Fit a curve”regress(vx, vy, k): the least-squares polynomial of degree k, read withinterp(regress(vx, vy, k), vx, vy, x).linfit(vx, vy, F): the best coefficients for a sum of terms you choose, given as a function returning a vector:F(t) := [1; t; t^2].- For a model of your own, a solve block with
minerrfits any formula.
Statistics
Section titled “Statistics”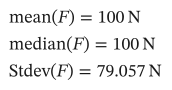
As text
mean(F) = ? N
median(F) = ? N
Stdev(F) = ? N
stdev and var are for a whole population (dividing by n), Stdev and Var for a sample (by n − 1). The statistics functions include the normal distribution, histograms and random numbers.