
Plots
A plot draws one or more curves against a variable. It sees the definitions above it, like any statement there.
Insert one
Section titled “Insert one”Press @ on an empty spot of the page, choose Insert → X-Y plot, or click the plot button on the Insert palette. A working example appears (a sine wave), open as its settings, which are a few lines of text:
x: 0 .. 2*πtraces: - y: sin(x) label: sin(x)axes: x: { grid: true } y: { grid: true }Change them, then press Escape (or click elsewhere) to draw the plot. Click the plot again to change it.
A function of x
Section titled “A function of x”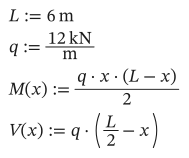
As text
L := 6 m
q := 12 kN/m
M(x) := q*x*(L - x)/2
V(x) := q*(L/2 - x)
title: Moment and shearx: x = 0 m .. Lx_unit: mtraces: - y: M(x) unit: kN*m label: Bending moment - y: V(x) unit: kN label: Shear axis: right style: { line: dash, color: red }axes: y: { grid: true }x: x = 0 m .. Lnames the variable and its range. Without a name (x: 0 m .. L) the variable isx. The curve is sampled at 200 points by default (samples: 500for more).- Each trace’s
yis worked out at every x.unitsets the unit it is drawn in; the axis label shows it. axis: rightputs a trace on a second y axis, with its own unit.- A point that can’t be worked out (a division by zero) leaves a gap in the curve.
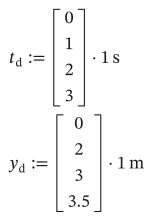
To plot measured points, give vectors of the same length for x and y:
As text
t_d := [0; 1; 2; 3]*1 s
y_d := [0; 2; 3; 3.5]*1 m
x: t_dtraces: - y: y_d label: Measured style: { line: none, marker: circle }A stepped range plots at exactly its values: x: x = 0, 1.5 m..L.
Under axes:, each of x, y and y2 (the right axis) can take:
| Setting | Does |
|---|---|
min, max | The ends, in the axis’s unit (otherwise they fit the data) |
step | The distance between ticks |
log: true | A logarithmic scale; a sampled x range is then spaced evenly in log |
grid: true | Grid lines |
label | The axis’s label, instead of the trace’s name and unit |
title: Low-pass filterx: f = 1 Hz .. 100 kHzx_unit: Hztraces: - y: 1/sqrt(1 + (f/(100 Hz))^2) label: Gainaxes: x: { log: true } y: { log: true, min: 0.001 }Line styles
Section titled “Line styles”style takes line (solid, dash, dot or none), marker (none, circle or square) and color (blue, red, green, orange, purple, black, gray, or #rrggbb).
Parametric curves
Section titled “Parametric curves”A trace with an x of its own draws (x, y) as the plot’s variable runs:
title: Ellipsex: t = 0 .. 2*πtraces: - x: 3 m*cos(t) y: 2 m*sin(t)Select a plot (drag a rectangle around it, or Ctrl+click it) and drag the handle at its bottom-right corner. Right-click a plot for Copy as image, to paste it into another program.